J.P. Morgan Asset Management - 2026 Outlook - A temporary pause in economic strength
The more chaotic the political backdrop becomes, the more we are seeing governments spend.

We called our 2026 Investment Outlook Fuel in the engine, capturing our expectation that the combination of monetary and fiscal fuel would power a broadening in economic activity by sector and geography. We expected 2026 to be a good year for global growth, and in the early months all was looking good.
Short-term damage to one of the main growth drivers
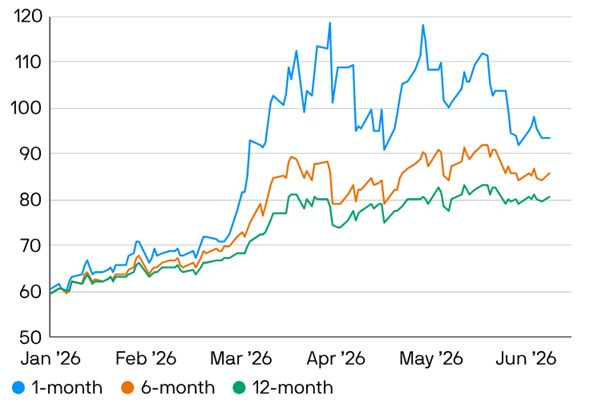
The conflict in the Middle East has dented the ‘all engines’ nature of our growth outlook, particularly for consumer spending. Higher energy prices are in the process of pushing up headline inflation and will likely feed into a broader range of prices, such as food, as the year progresses (Exhibit 1).
This situation is not like the cost shock of 2022, however. Back then, the world economy was only just re-opening after a global pandemic, with booming demand and a buoyant labour market. Inflation thus took off and required considerable interest rate hikes to get it back under control.
This time around the labour market is much weaker (Exhibit 2). While some are already pointing to the impact of artificial intelligence (AI), the data isn’t conclusive. In the US, government cutbacks have played a significant role. And in Europe, labour market weakness represents corporate caution in a world where demand is only just recovering, although in the UK the rising minimum wage and employers’ national insurance contributions seem to have had a bigger effect.
Exhibit 1: The Middle East conflict is pressuring input costs…
Composite PMIs: Input prices
Index level
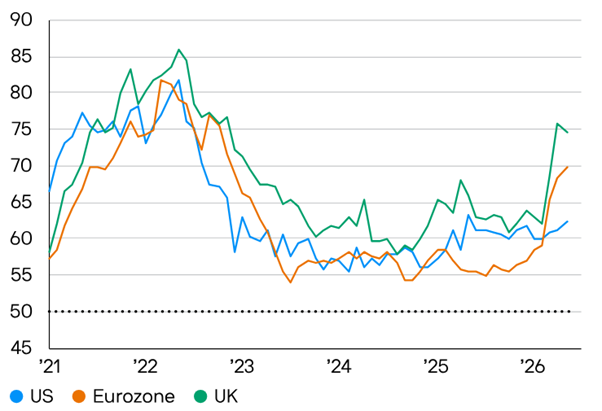
Source: Bloomberg, S&P Global, J.P. Morgan Asset Management. A Purchasing Managers' Index (PMI) score of 50 indicates that prices are neither rising nor falling, above 50 indicates rising prices. Data as of 8 June 2026.
Exhibit 2: …but unlike 2022, labour markets are relatively cool
Composite PMIs: Employment
Index level
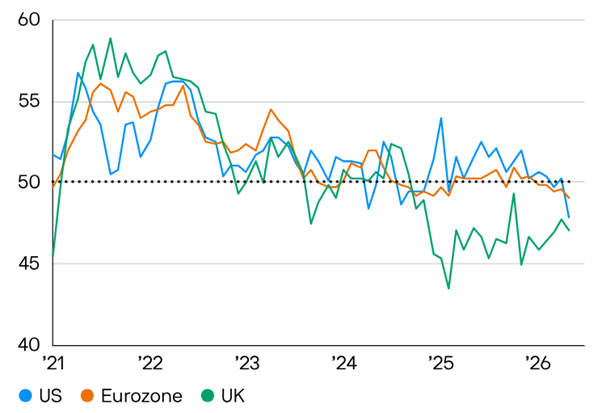
Source: Bloomberg, S&P Global, J.P. Morgan Asset Management. A Purchasing Managers' Index (PMI) score of 50 indicates that employment is neither rising nor falling, above 50 indicates rising employment. Data as of 8 June 2026.
Either way, workers are unlikely to get significant pay rises to compensate for the higher cost of living. Higher inflation will therefore squeeze disposable income, and in turn consumer spending, in the remaining months of the year.
This income squeeze hasn’t yet had much of an impact on US activity, which may be because workers have had their incomes supported by the tax rebates that were part of the One Big Beautiful Bill Act. Households will start to feel the pressure of higher gasoline prices more acutely in the remainder of the year, which may have implications for the upcoming midterm elections. One of our key risks in the second half of the year is that President Trump announces a new set of cheques in the post to buoy the electorate. With the US deficit already stuck at 6%, the bond market may not cheer. But it’s a risk, rather than our central expectation. You can read more about our expectations for policy before and after the midterms in the chapter: Don’t be derailed by the US midterm elections.
The impact of the income squeeze is more evident in Europe, where the service sector business surveys show that households are feeling the pinch. We are not, therefore, seeing the recovery in consumer spending that was a central tenet for our expectations of a more robust recovery this side of the Atlantic.
Consumer spending has been much weaker in all the major European countries than in the US since the pandemic. The reason appears to be a lack of confidence among European households, who tend to react more to uncertainty than their US counterparts (Exhibit 3). Americans were quick to spend their pandemic savings and, more recently, have been willing to spend despite falling disposable income (Exhibit 4). In Europe, by contrast, we have not only held on to our post-pandemic savings, but we also continue to save more than ‘normal’. Until European households feel confident enough to go and spend, Europe will remain the laggard in the post-pandemic recovery.
Exhibit 3: European households have exhibited greater post-pandemic caution…
Excess savings rates
% points, savings rates relative to 2015-2019 average
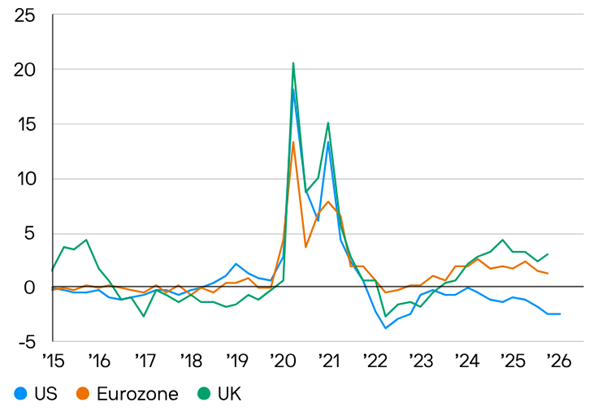
Source: BEA, Eurostat, LSEG Datastream, ONS, J.P. Morgan Asset Management. Data as of 8 June 2026.
Exhibit 4: …while a slowdown in real income growth has not stopped Americans from spending
US real disposable income and consumer spending
% change year on year
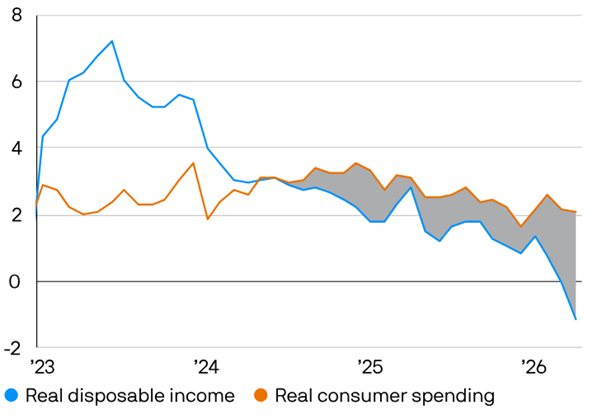
Source: BEA, LSEG Datastream, J.P. Morgan Asset Management. Data as of 8 June 2026.
The weakness of wage growth in the western economies at least means that the central banks will be less worried about inflation getting entrenched. As a result, we don’t expect energy price woes to be compounded by higher interest rates. Back in 2022, households and firms had to face the double problem of rising costs and rising interest rates. This time around, most central banks have interest rates in neutral or restrictive territory. Therefore, while not much monetary fuel is being added to the fire we do not believe there will be any concerted efforts to dampen growth. We expect all the major western central banks to hold rates steady through the remainder of the year.
How long higher energy prices remain a headwind to consumer spending depends on how quickly the Strait of Hormuz re-opens (even if all aspects of a ‘deal’ are yet to be resolved), and how long it takes the energy market to normalise. In both cases the timing is highly uncertain, as the outcomes depend on several relatively opaque factors.
The Gulf states have done their best to keep the oil flowing from the ground, using alternative pipes and routes for exports, and putting any excess into available storage. But despite these efforts, and assuming that flows through the Strait gradually accelerate from June, the International Energy Agency forecasts that production will decline by 3.9 million barrels per day this year relative to 2025 (which equates to a loss of roughly 4% of total production). In addition, there is limited shipping capacity available to get the oil that is in storage out into the world when safe passage is secured.
Another issue is how much damage has been done to energy infrastructure, although we think this concern is overblown. Qatar, for example, has been in the news due to the damage that has been caused to two of its 14 liquefied natural gas (LNG) producing vessels, known as ‘trains’. However, while the damage may take three-to-five years to restore, Qatar already has four more LNG trains in construction, which are still likely to be complete as early as next year.
Higher oil prices also act as a strong incentive on the region to pump as much oil as it can, specifically given OPEC commitments have been structurally weakened with the departure of the UAE from the cartel. However, additional supply could get absorbed by governments around the world attempting to build strategic inventories in fear of new tensions. In this case, demand and prices would remain elevated.
The uncertainty in the outlook for oil prices can be seen in the different oil contracts (Exhibit 5). Overall, we are working on an assumption that oil prices end the year between USD 80-90 per barrel before falling back below USD 80 per barrel in 2027. But there are two-sided risks around this scenario. At the start of the year, for example, one of the key points of discussion was the prospect of an energy glut due to new capacity.
Exhibit 5: Oil price futures suggest markets are anticipating a resolution ahead
Brent crude oil price futures
USD per barrel
Source: LSEG Datastream, J.P. Morgan Asset Management. Past performance is not a reliable indicator of current and future results. Data as of 8 June 2026.
The tech capex engine is still firing on all cylinders
While prospects for consumer spending have been dented by surging energy prices, the other key engine of growth, business capex, is still firing in certain regions. The US hyperscalers continue to ramp up their spending ambitions, which is powering not only US growth, but also growth in those markets that provide the chips and other inputs that the hyperscalers need.
China is embarking on its own AI boom, seeking to emulate US technology growth and win the AI race. How China’s efforts interplay with US tech ambitions is yet to be seen and is therefore one of the key questions facing investors in US technology (The AI investment boom is reshaping stock market winners).
While AI capex looks likely to continue to fuel global growth, we will also start to learn more about the potential productivity gains that the broader corporate universe is managing to achieve by utilising AI. These potential gains are being seen as software’s loss, creating pressure on software-heavy private credit funds. We don’t see this pressure as substantial enough to derail our pro-risk view, however (Private credit will not upset risk sentiment).
Broadly speaking, if the tech stocks deserve their valuations, AI should be a powerful source of productivity and profitability across the world, dispersing growth by sector and region. Europe has not been at the forefront of the production of new technologies, but is showing encouraging signs in terms of AI adoption (Exhibit 6).
Exhibit 6: Europe has caught the US in terms of AI adoption
Share of companies using AI
%
Source: McKinsey & Company via AI Index Report with major processing by Our World In Data, J.P. Morgan Asset Management. Organisations are counted as using AI if they report using it in at least one business function. The definition of AI includes broader technologies, such as machine learning and natural language processing, as well as generative AI. Data as of 8 June 2026.
The government engine may get yet more fuel
Government spending was expected to be another major engine of growth this year. Geopolitical uncertainty and the fragmentation of previous relationships between regions is leading to a whole host of spending aimed at improving ‘national resilience’. The more chaotic the political backdrop becomes, the more we are seeing governments spend, which is one of the central tenets driving a wedge between negative political headlines and positive market sentiment.
The German fiscal stimulus, one of the big stories of 2025, is now slowly being dispersed. While there is much debate (and scepticism) about the long-term productivity enhancements, in the near term we still expect this spending to be a major support to the biggest eurozone economy.
Back up and running in 2027
Overall, our assessment is that the positive story of growth accelerating and broadening has been damaged by the Middle East conflict, but not irreparably. Once the Strait re-opens and energy prices fall back, all engines should be up and running again in 2027.
Given markets are forward looking, they should anticipate the more buoyant backdrop, which keeps us generally positive about the outlook for risk assets (Staying risk on in our market outlook). However, there are a wide range of risks to this benign scenario, so our chapter on key tail risks warrants careful scrutiny (The risks are clear and so is the protection).
📄 Download the Mid-Year Investment Outlook 2026
Important Information:
This article is authored by J.P. Morgan’s Market Strategists Team. The views and opinions expressed herein are his own and may differ from those of J.P. Morgan, its businesses or its personnel.
This document is a general communication being provided for informational purposes only. It is educational in nature and not designed to be taken as advice or a recommendation for any specific investment product, strategy, plan feature or other purpose in any jurisdiction, nor is it a commitment from J.P. Morgan Asset Management or any of its subsidiaries to participate in any of the transactions mentioned herein. Any examples used are generic, hypothetical and for illustration purposes only. This material does not contain sufficient information to support an investment decision and it should not be relied upon by you in evaluating the merits of investing in any securities or products. In addition, users should make an independent assessment of the legal, regulatory, tax, credit and accounting implications and determine, together with their own professional advisers, if any investment mentioned herein is believed to be suitable to their personal goals. Investors should ensure that they obtain all available relevant information before making any investment. Any forecasts, figures, opinions or investment techniques and strategies set out are for information purposes only, based on certain assumptions and current market conditions and are subject to change without prior notice. All information presented herein is considered to be accurate at the time of production, but no warranty of accuracy is given and no liability in respect of any error or omission is accepted. It should be noted that investment involves risks, the value of investments and the income from them may fluctuate in accordance with market conditions and taxation agreements and investors may not get back the full amount invested. Both past performance and yields are not reliable indicators of current and future results.
June 2026
Please note that these are the views of J.P. Morgan Asset Management and should not be interpreted as the views of RL360.